OVERNIGHT BENCHMARK
SOFR
——
Overnight fixing · last year of daily observations
Overnight SOFR
Daily overnight fixing published by the New York Fed.
The cost of capital, the supply chain, and the grid.
Daily overnight fixing published by the New York Fed.
Maturity categories are equally spaced · yields in percent.
| Tenor | 27 Oct | 1W ago | 1M ago | 1Y ago |
|---|---|---|---|---|
| 1 month | 3.93% | 3.93% | 3.90% | 3.98% |
| 3 months | 4.06% | 4.06% | 4.07% | 3.84% |
| 1 year | 4.36% | 4.40% | 4.44% | 3.56% |
| 2 years | 4.53% | 4.57% | 4.65% | 3.31% |
| 5 years | 4.55% | 4.65% | 4.73% | 3.28% |
| 10 years | 4.60% | 4.75% | 4.80% | 3.56% |
| 15 years | 4.70% | 4.87% | 4.89% | 3.78% |
| 20 years | 4.74% | 4.92% | 4.92% | 3.88% |
| 30 years | 4.66% | 4.84% | 4.83% | 3.86% |
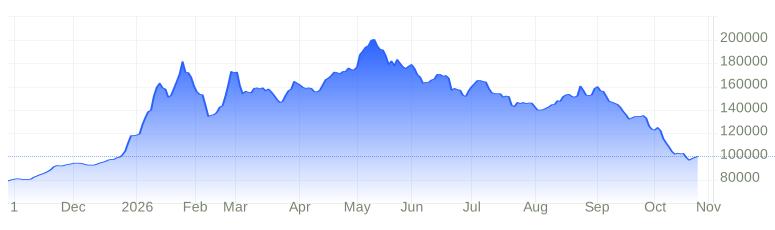
One-year source chart · fixed snapshot captured Oct 28, 2026.
Latest 52 reported weekly averages, dated by week ending.
Today’s source data, Pacific time.
Hourly day-ahead schedules and five-minute real-time prices.
Negative battery values indicate charging. Future intervals stay blank.
Data directly from CAISO OASIS and Today’s Outlook. Refresh always checks today. Source observation times may differ.